v1.2 Update: Custom Injection, Guided Scenarios, and More
Today we are happy to release a new update to the SAI Simulator that contains some exciting new features: Support for custom injection at different latitudes, guided scenarios, and hatching to visualize statistically significant departures from the natural variability of the climate. (For more background on why Reflective created the Simulator, see our recent blog post.)
Custom injection enables users to specify the SO2 injection amount per decade at 7 different global latitudes.
We know that the impacts of an SAI deployment would be determined in large part by how–at what latitudes, in what years, and how much–SO2 is injected into the atmosphere.
The previous version of the Simulator allowed users to select a cooling target and start date for deployment, but held fixed where SAI is deployed along what would be “optimal” to achieve the given cooling target as evenly as possible around the world. Most importantly: The previous version controlled the latitudes at which injection occurs and the amount of SO2 injected.
There are good reasons to model a wider range of SAI injection schemes, including suboptimal scenarios. Operational, economic, geopolitical, or other uncertainties are likely to come into play. For example, recent research from Reflective scientist Alistair Duffey (et al) shows that deployment at high-latitudes could generate meaningful global cooling, even at the comparatively low altitudes reachable by existing large aircraft, but at the cost of reduced efficiency and a more polar cooling pattern.
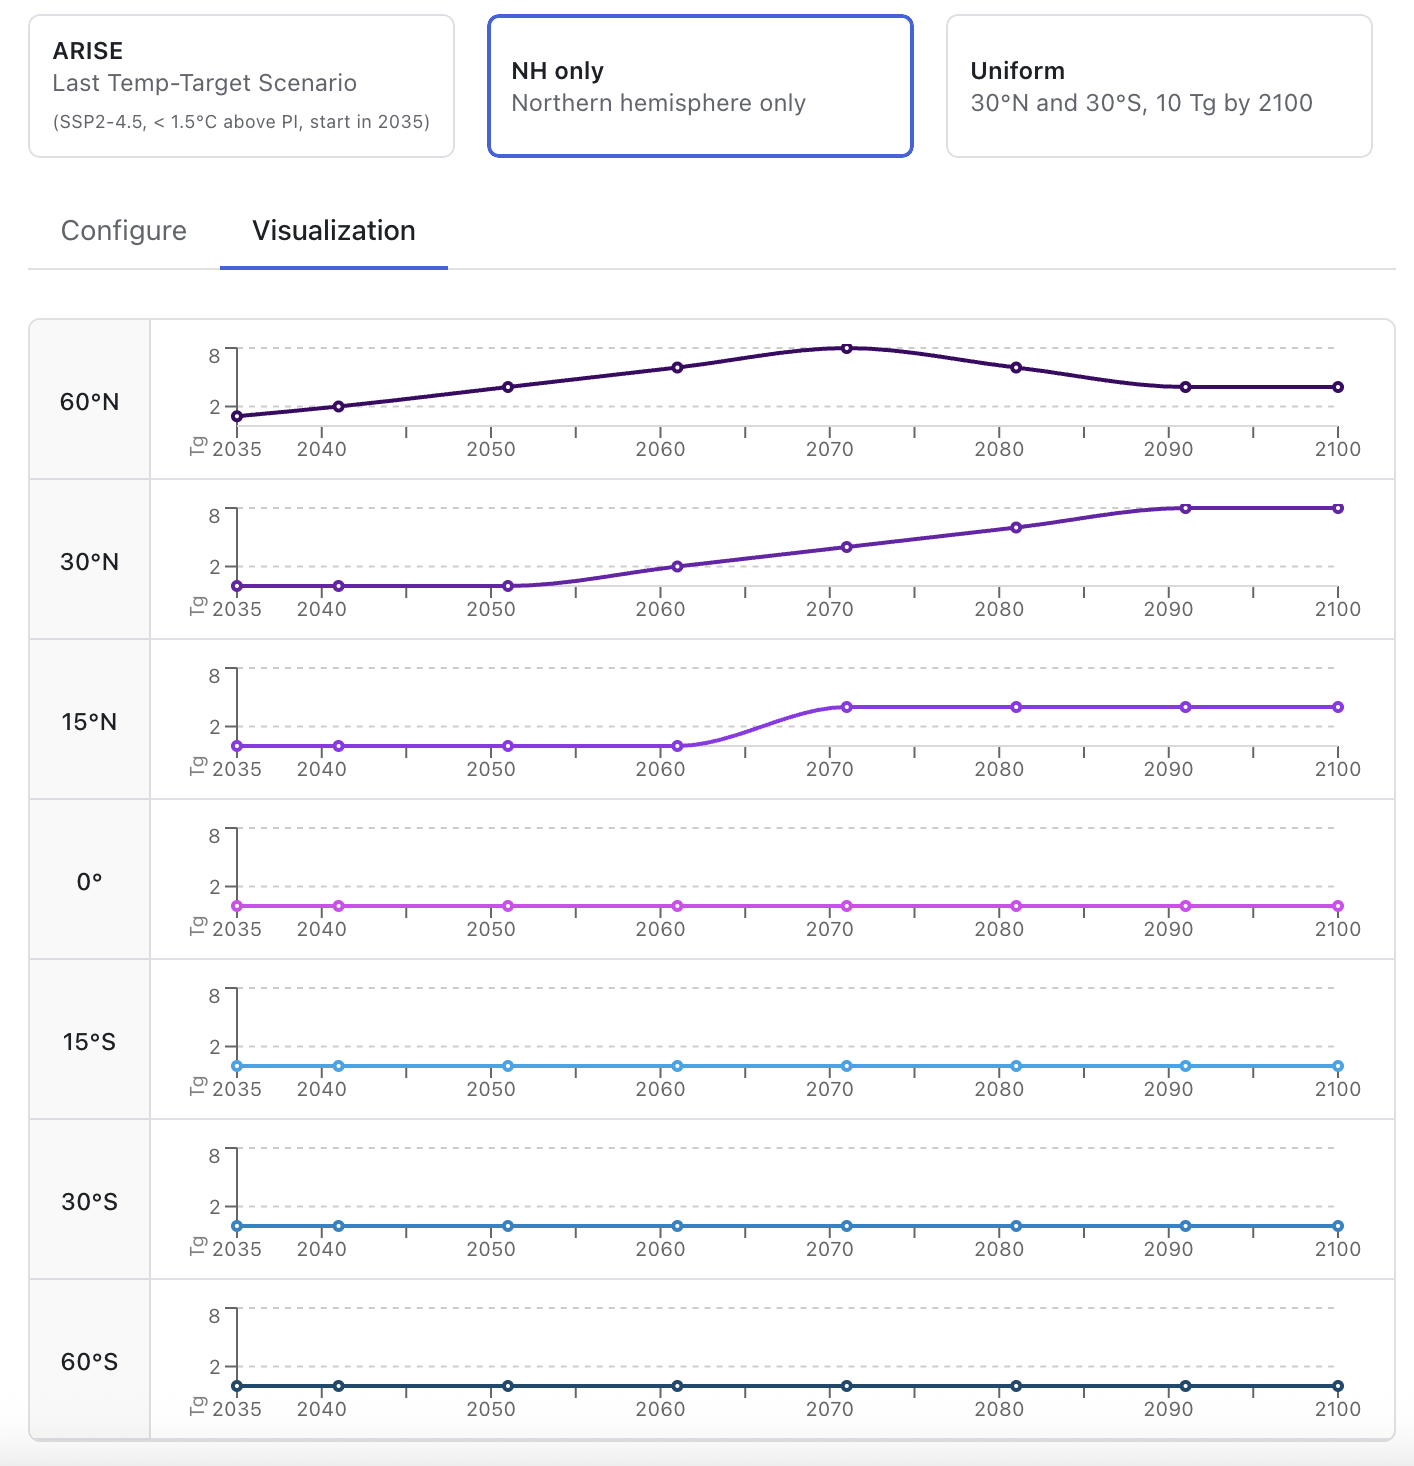
Users are also now able to model custom injection schemes to explore the impact of, for example, a unilateral deployment at a single latitude or hemisphere. Custom injection can help users ask questions like: What is the impact of a deployment only in the Northern Hemisphere? How would those deployment scenarios affect temperature and water availability, and how would the impacts compare to those of a more global, multinational deployment that might ensure more even cooling globally?
We’d like to thank Jared Farley at Cornell for his scientific and technical support integrating custom injection. Jared’s preprint describing custom injection modeling in more detail is available here.
Guided scenarios allow users to explore pre-developed SAI deployment scenarios, designed and narrated by global researchers.
The goal of this feature is to make it easier for new users to explore the Simulator, grounded in scenarios and findings from leading climate researchers from around the world.
We collaborated with three researchers from The DEGREES Initiative community to bring a few initial guided scenarios to life:
| Dr. Pornampai (Ping-Ping) Narenpitak, National Science and Technology Development Agency looks at temperature and water availability changes over Thailand, including heavy rain exposure. | Dr. Athar Hussain, COMSATS University, Islamabad examines how malaria incidence rates would change under baseline warming scenario versus SAI scenario in South Asia. | Dr. Franklin Opijah, University of Nairobi, looks at the impacts of baseline warming versus SAI, and the change in minimum and maximum temperature over E Africa. |
 |  |  |
These researchers have designed custom scenarios, often focused on their region of interest, then provided voice-over narration to help users understand the scenario and interpret the results. By amplifying perspectives from Global South, we also aim to facilitate a broader and more inclusive discussion about SAI.
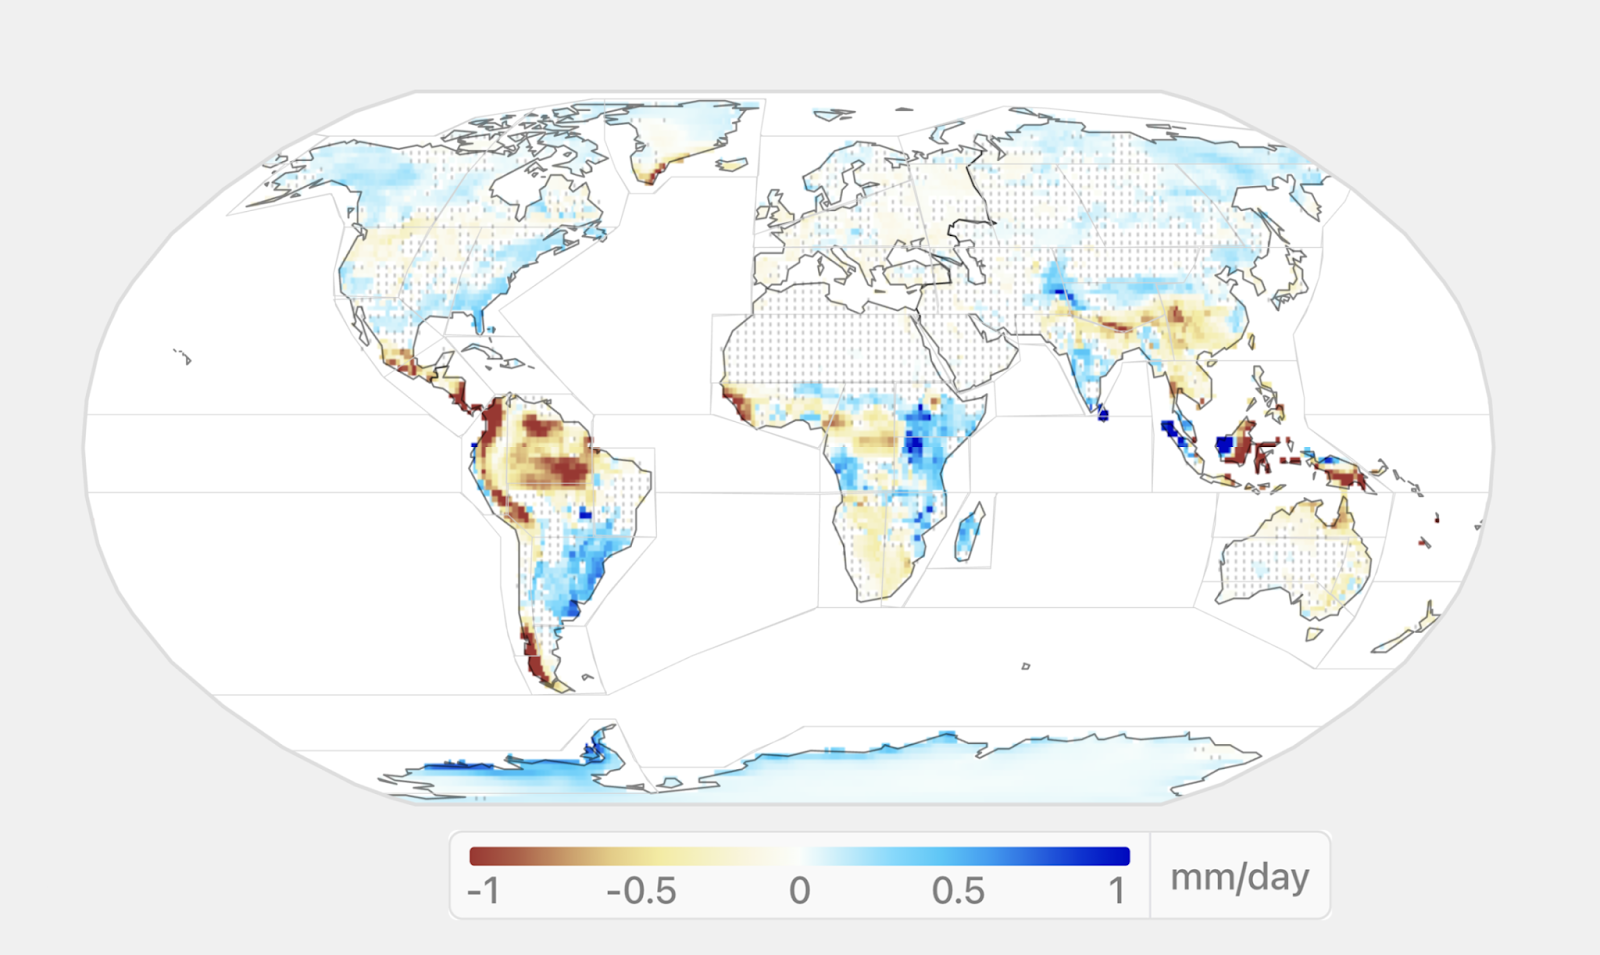
Significance hatching is a new visual feature that helps users understand, for any given Simulator output, whether or not the result is statistically significant compared to the usual and expected variability of the climate. Regions are visually “hatched” where, according to a t-test, the change in the given scenario is insignificant compared to climate internal variability. This is estimated using the 20 year preindustrial distribution of the variable.
Finally, we’ve made several minor updates to help users navigate the Simulator and learn the basics of SAI.
If you have questions, feedback, or ideas for features you’d like to see in future versions, please get in touch.